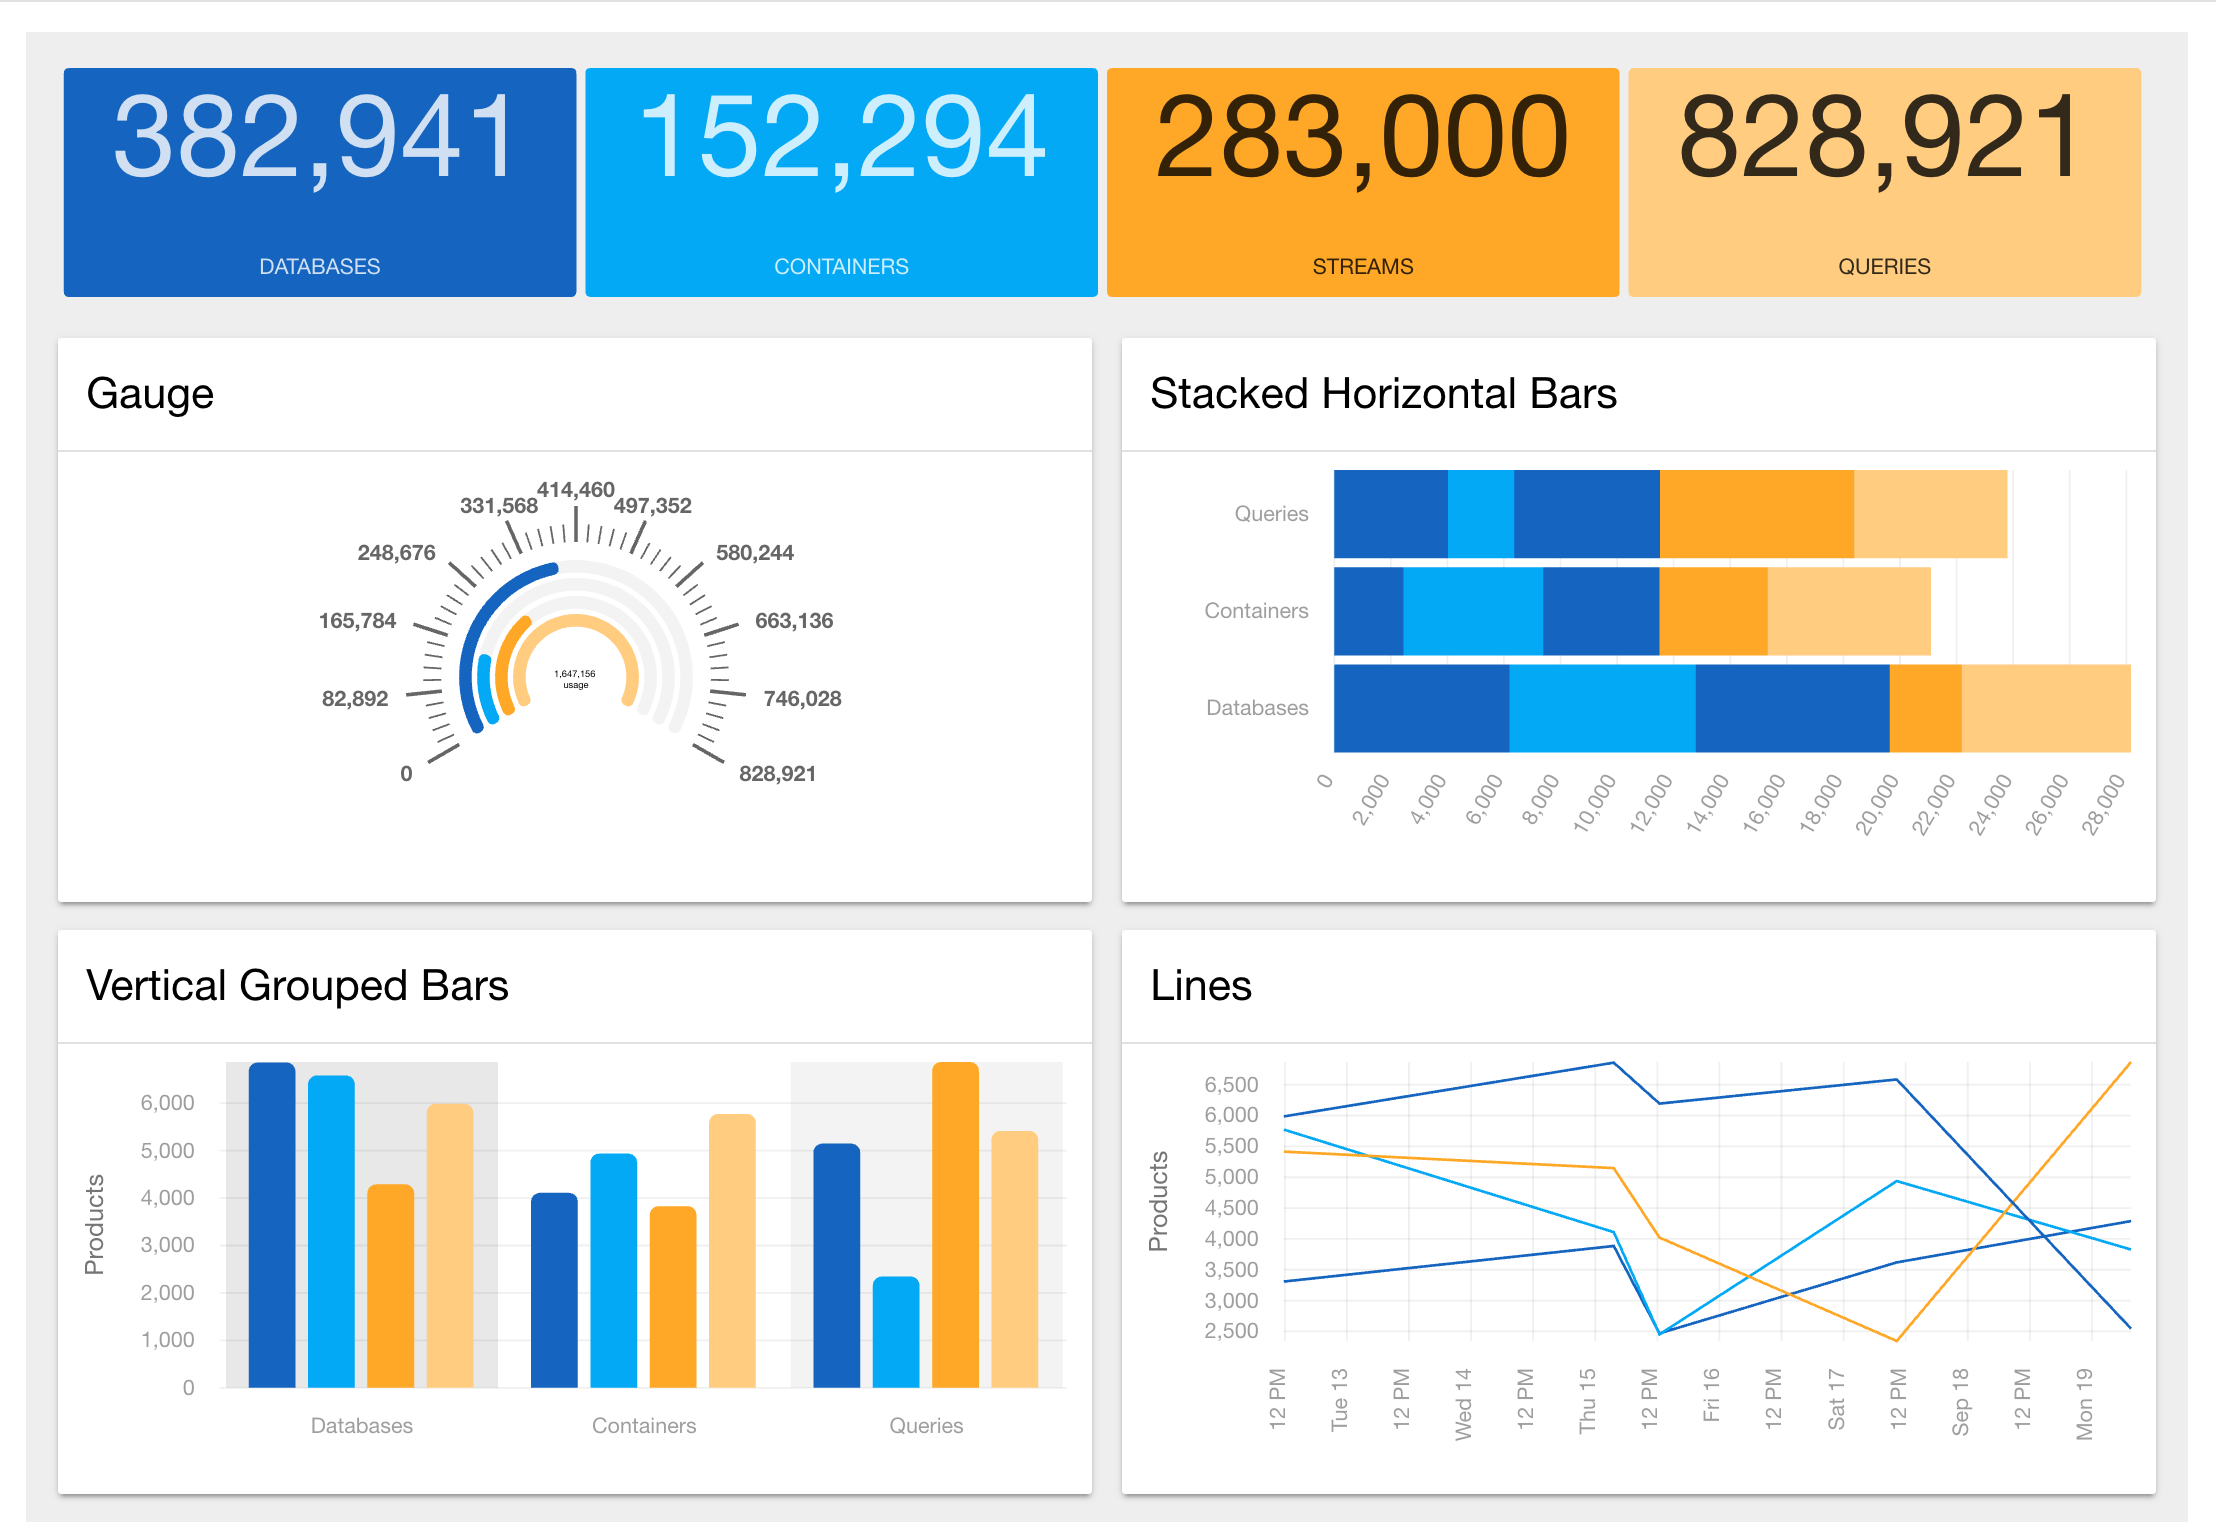
NGX-Charts
Rather than building & maintaining our own td-charts D3 component, we've opted instead to partner with an external open-source library, NGX-charts.
Some key features which make NGX-Charts effecient:
- Native Angular2 component instead of a simple wrapper
- Angular2 click events on every chart element possible
- Separation of shared & common chart elements
- Easily add new chart components in a modular fashion
- Everything is styled via SCSS

Charts Types
There is a huge list of charts supported by them:
- Pie
- Area
- Line
- Bar
- Number Cards
- Bubble Chart
- Tree
- Force Directed Graph
& many more are still being added!!
Themeing SCSS
NGX-charts style is completely done is scss and that's extremely easy to customize. We use scss for covalent too. So adding any style on top of their styles is simple:
[ngx-charts-axis-label] text {
    fill: md-color($foreground, secondary-text);
}

.legend-title-text {
    color: md-color($foreground, secondary-text);
}
Data Formats
There are two formats supported by ngx.
Single
for flat/non-nested data object.
export let single: any = [
  {
    'name': 'Databases',
    'value': 382941,
  },
  {
    'name': 'Containers',
    'value': 152294,
  },
  ...];
Multi
for nested data object
export let multi: any = [
  {
    'name': 'Databases',
    'series': [
      {
        'value': 2469,
        'name': '2016-09-15T19:25:07.773Z',
      },
      {
        'value': 3619,
        'name': '2016-09-17T17:16:53.279Z',
      },
      ...]
  }
];
How to pull this data into your component
To use this data in a component, we just have to import the formats & data:
import { single, multi } from './data';

@Component({
  ...
})
export class NgxChartsDemoComponent {

  single: any[];
  multi: any[];
define the size of the chart container
view: any[] = [700, 400];
set options for template rendering
showXAxis: boolean = true;
showYAxis: boolean = true;
gradient: boolean = true;
showLegend: boolean = false;
showXAxisLabel: boolean = true;
xAxisLabel: string = '';
showYAxisLabel: boolean = true;
yAxisLabel: string = 'Sales';
define color scheme for charts
colorScheme: any = {
    domain: ['#1565C0', '#03A9F4', '#FFA726', '#FFCC80'],
  };